What is Power BI
BI basics, Terminology and definitions
Power BI is a collection of software services, apps, and connectors that work together to turn your unrelated sources of data into coherent, visually immersive, and interactive insights. Whether your data is a simple Excel spreadsheet, or a collection of cloud-based and on-premises hybrid data warehouses, Power BI lets you easily connect to your data sources, visualize (or discover) what’s important, and share that with anyone or everyone you want.

Power BI can be simple and fast – capable of creating quick insights from an Excel spreadsheet or a local database. But Power BI is also robust and enterprise-grade, ready for extensive modeling and real-time analytics, as well as custom development. So, it can be your personal report and visualization tool, and can also serve as the analytics and decision engine behind group projects, divisions, or entire corporations.
The parts of Power BI
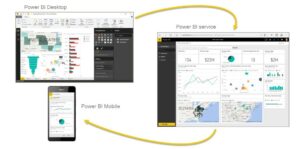
Power BI consists of a Windows desktop application called Power BI Desktop, an online SaaS (Software as a Service) service called the Power BI service, and mobile Power BI apps available on Windows phones and tablets, as well as for iOS and Android devices.

These three elements – the Desktop, the service, and Mobile – are designed to let people create, share, and consume business insights in the way that serves them, or their role, most effectively”. Microsoft Web Site (https://docs.microsoft.com/en-us/power-bi/power-bi-overview)
Inventory Warehouse Management Applications of Power BI
Understanding Inventory Management is crucial for any business with a supply chain. Inefficiencies in Inventory Management can erode profitability even as revenues grow. It is important to efficiently manage the inventory for profit maximization and improving customer satisfaction.
Any inefficiencies in Inventory Management can lead to lost revenues (stock out and customer churn) and increased costs (excess inventory). Business Intelligence tools can help businesses easily monitor Inventory levels and enable Inventory optimization decisions.
Companies should leverage BI software to accurately plan and optimize their inventory based on historical Receiving Orders, Shipping Orders, Inventory Rotation and other performance data such as trends in inventory turns. This helps ensure the company always has an optimal amount of inventory in stock so the supply chain never experiences a problem in missing sales or overstocked Items.
Business Intelligence software can measure:
- Available to promise (ATP)
- Current and future Stock status to identify likely shortages.
- Inventory valuation
- Projected Customer Demands
- Current and future Excess inventory
- Dead stock analysis (including forward orders for products which have sold little in recent months)
- Inter-company movement stock analysis.
- Inventory point-in-time levels (e.g. capturing inventory levels at the start/end of each period, such as monthly, to build up an inventory trend picture)
- Sales orders, invoices, back orders and forward orders in any combination, sliced & diced to your requirements.
Through Management Dashboard BI can combine sales data, forecast data and replenishment data to ensure stock levels are exactly where they need to be at all times. Since BI software can pull in data from so many sources, managers get a 360-degree view of their inventory that is accurate and up-to-date at all times. Suppliers and distributors can also use this data to identify which products have the slowest turnover, so they aren’t overstocked with products that don’t quickly produce revenue.
This real-time visibility, performance monitoring, and automatic alerts when unexpected variances or events take place give managers the insight, they require to make better operational decisions – the kind of decisions that can ultimately drive down safety stock, reduce lost sales and minimize the costs and time related to inventory management.
A Business Intelligence tool will provide Inventory Managers with deep insights into product performance and moreover into customer behavior; helping them address all challenges. Business Intelligence tools can be used to not only generate reports about current levels of the inventory, but also answer deep questions about customer transactions, inventory turnover, customer behavior, etc.
___________________________________________________________________
What they require is not Inventory Management but Inventory Visibility. And that is where Business Intelligence comes in. For some years, giant do-everything BI/Business Warehouse type of solutions (the ones with the giant price tags to match) have offered to cover this area in a general sense. But more recently, increasingly affordable, specialized manufacturing/distribution BI packages have been offering better targeted solutions to this issue. For the non-specialist key staff in those other departments of the company, a good BI tool can offer such Inventory analyses as: – This clearly taps into the understanding that an organization will create strong progress by utilizing company-wide data visibility (such as that delivered by a quality Business Intelligence solution) to latch onto potential areas of business growth: Inventory is just one such area!
